Sustainability of CPP - Annual Update
Read the original article published in Advisor.ca, dated May 14, 2021
Read
it in pdf format
My interview
(pdf) in Epoch Times , March 13, 2022
2021 Year-End Update:
(March 14, 2022)
CPP Pension
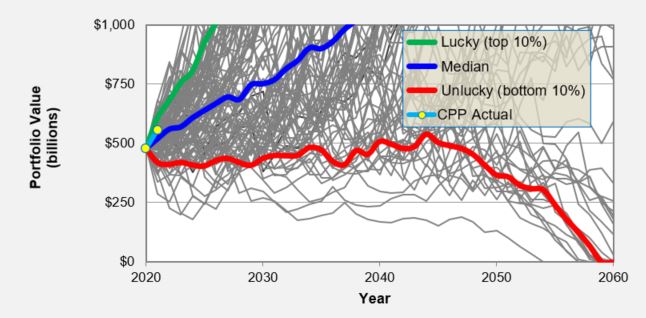
assets were $550.4 billion at the end of 2021 calendar year. This figure is
larger than the median line (dark blue on the graph) of our aftcast. As long as
the actual CPP Pension assets are above the dark-blue line, CPP Pension is
sustainable.
Headwinds:
A. Higher inflation means that in coming years, there will be a larger drain for retirement pension payments from these assets than originally forecasted. OCA used an assumed inflation rate of 2% for the next 75 years and we are already far above it. Keep in mind, even if the inflation drops to zero percent next year, the increased benefits with CPI indexation for this year remain in place "forever".
B. The current trend for deglobalization means: 1. Growth of the portfolio will be stunted, 2. Current high inflation rate will drag on longer (regardless of Central banks policies), 3. Expected benefits from diversification will be lower, and 4. MERs will likely go higher.
C. Military conflicts and excessive government debt load means, eventually, governments might try to tap this mountain of assets, one way or another.
These headwinds will likely increase the probability of assets crossing below the blue median line within the next seven years or so.
Footnotes on possible outcomes:
A. If we are lucky (top decile), the CPP assets will reach $1 trillion in 2026, a very desirable outcome.
B.
In
the median scenario, the asset value rises gradually by about $31 billion per
year for the next 17 years and hits the $1 trillion mark around 2038. This would
also fulfill the CPP objectives.
C. If we are unlucky (bottom decile), then we have a problem. This can happen after significant bad sequence of returns and after higher inflationary environments. Here, CPP assets linger around the half-trillion mark for the next 25 years and then decline to zero around 2060.
The projected withdrawal rates from the CPP assets are not low enough to render the "luck factor" insignificant. In spite of the OCA’s “best estimate” forecasts, only time will tell where this goes in the next 75 years.
Cash Flow Projections:
This is the net cash flow of pension contributions and payments. The amounts for years 2018 and prior are actual numbers. The amounts after 2018 are OCA's forecast where they use a 2% inflation rate.
The question is, "Will the cumulative surplus of about $87 billion between 2000 and 2021, plus the growth of CPP investments, be sufficient to cover the cumulative shortfall of about $4.8 trillion over the next 75 years?"
For the answer, just look at this graph longer than a few seconds and you'll find the answer.
By the way, I learned a lot from reading stories like "Kejserens nye klæder" by Hans Christian Andersen when I was a little boy.
